MODIS
imagery
Northern Alaska
Robert Rabin1
1NOAA/NSSL and
UW-Madison/CIMSS
BACKGROUND
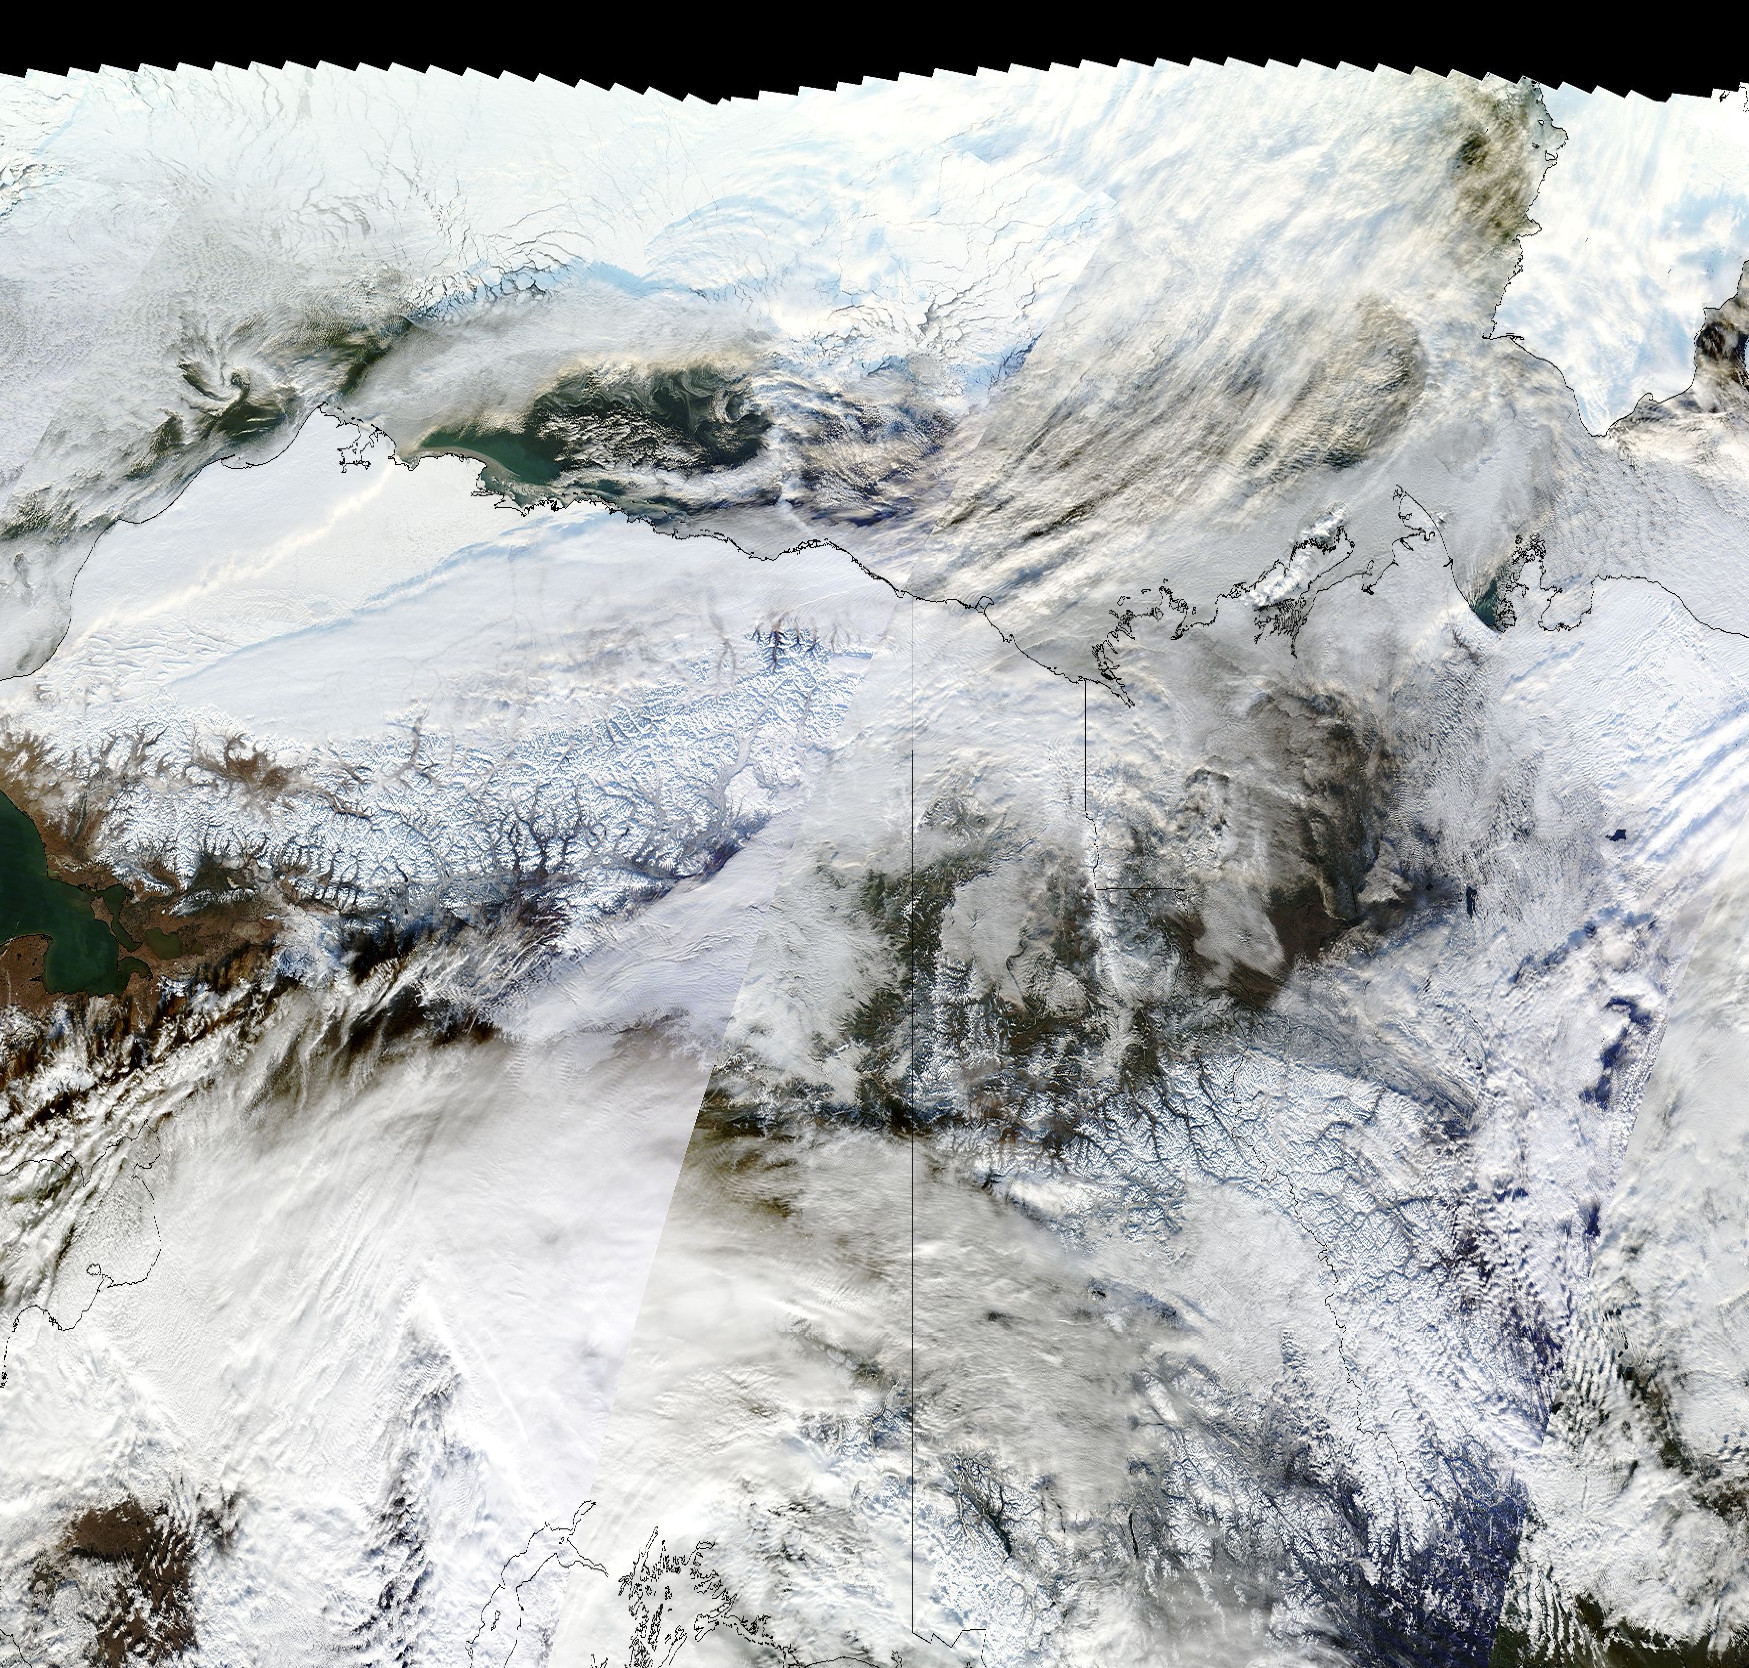
This web page provides imagery for northern Alaska and
surrounding areas from the NASA MODIS (Moderate Resolution Imaging Spectroradiometer) instrument aboard the TERRA
satellite. Overpass times are in the late morning. MODIS has 36
distinct spectral bands with wavelenghts ranging from 0.405 to 14.385
microns. The resolution of the near visible bands is 250 m. True
color images look like photographs, but they are actually created using
MODIS's red, green and blue bands. Because true color images represent
sums of the blue, green, blue bands, they are abbreviated by RGB (like
computer monitor output). Clouds are difficult to distiguish from
snow and ice cover because they appear white. However shadows from the
edge of clouds can often be seen on the snow and ice. Things to notice:
open water, leads or "cracks" in the ice.
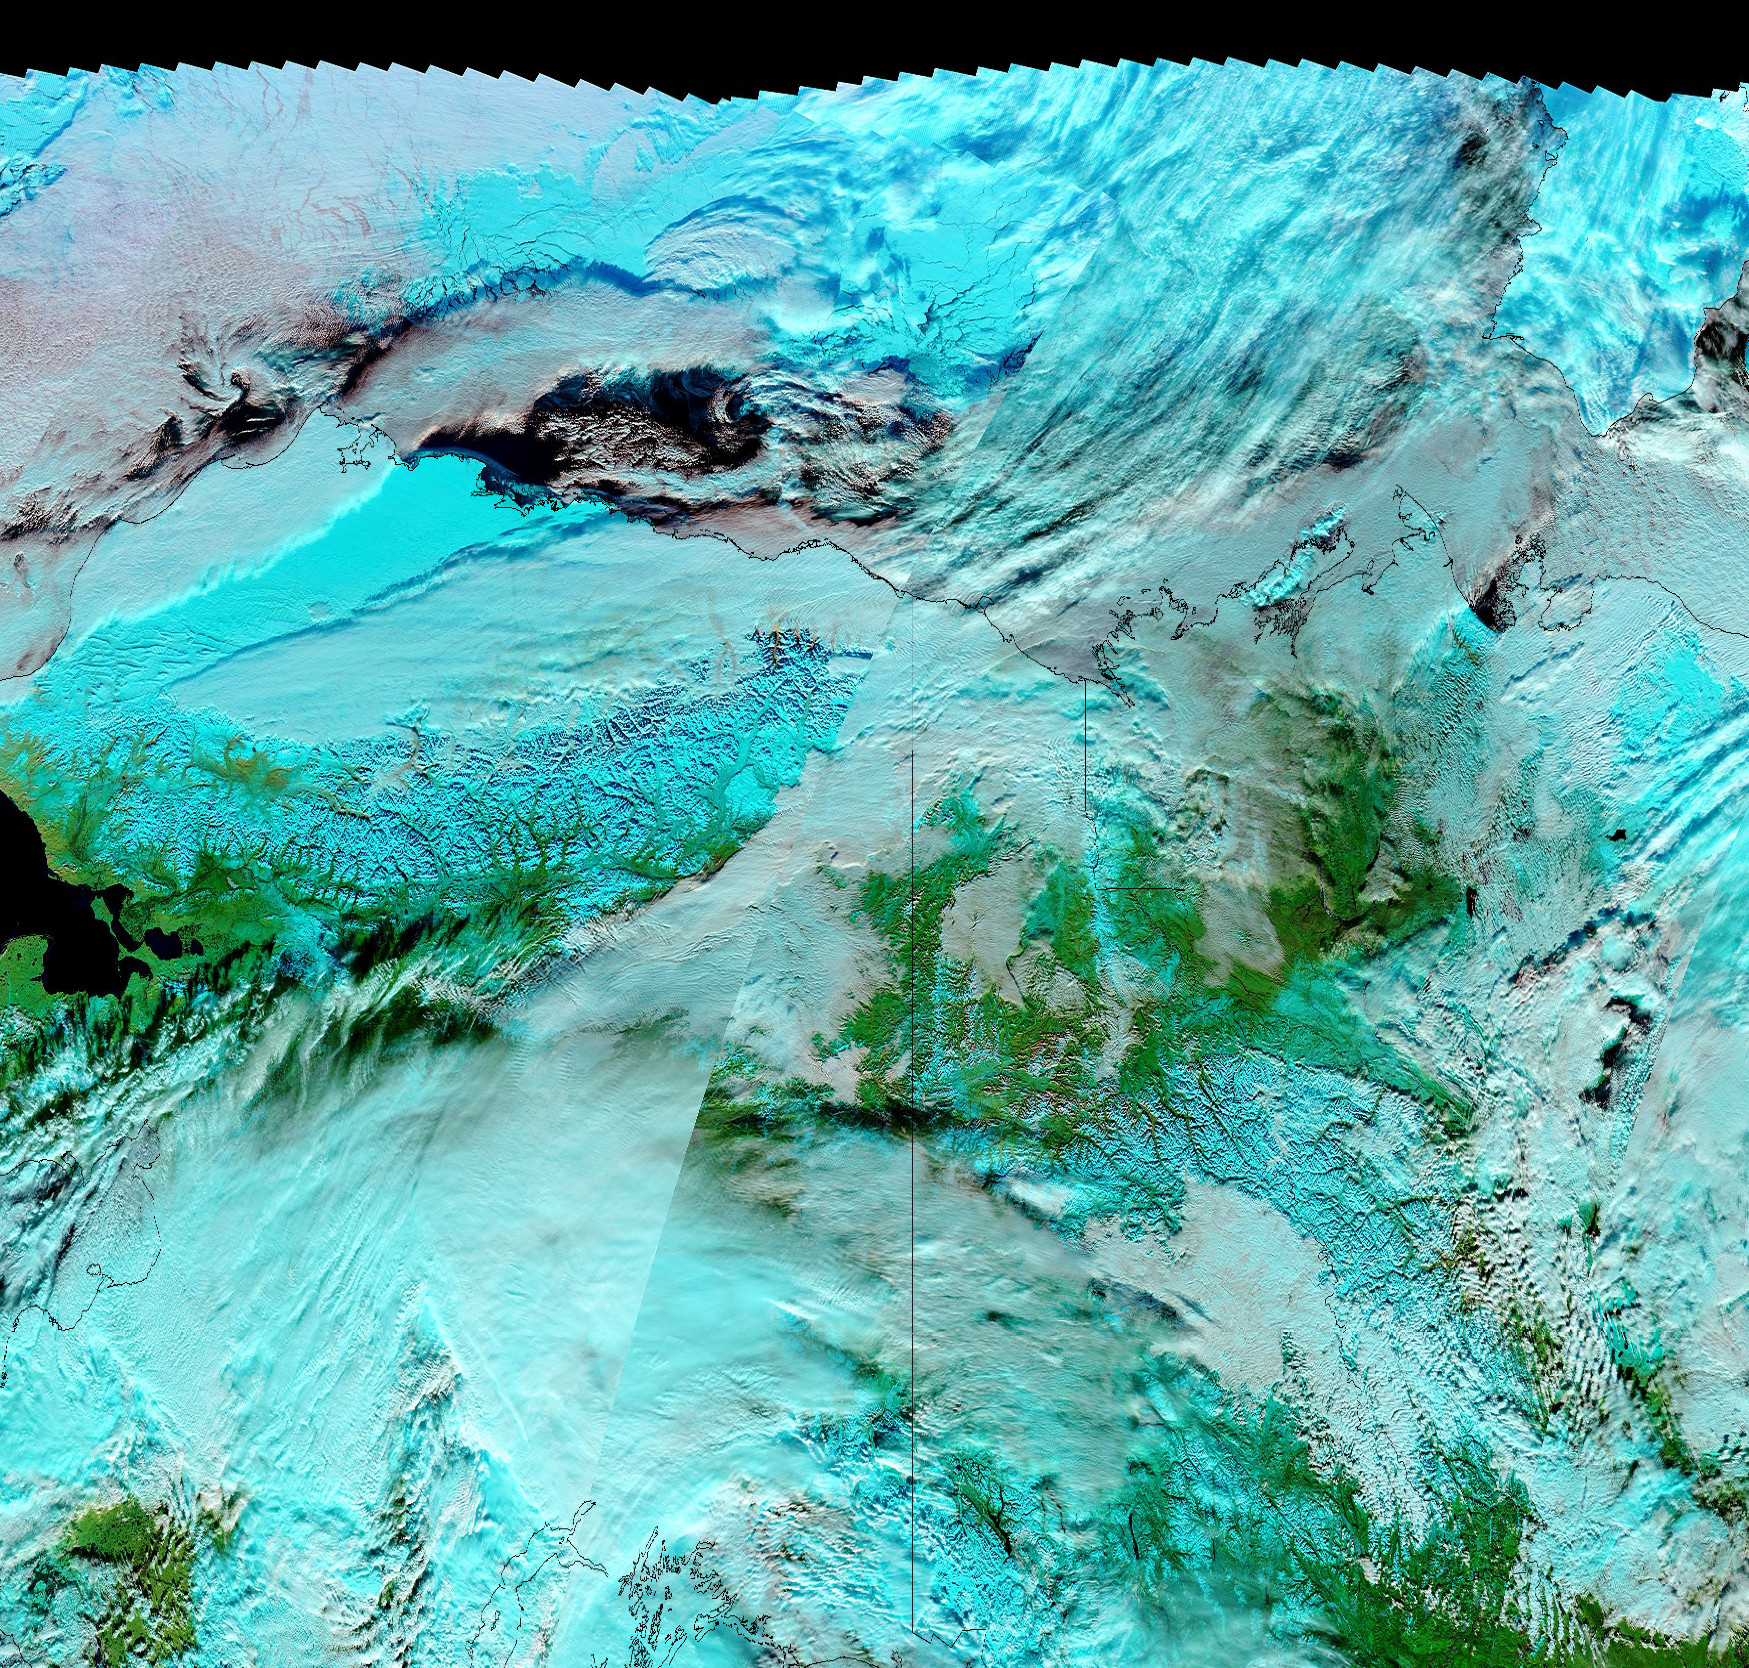
Photosythetically active vegetation cover can also be seen from an index called NDVI.
This index is based on the fact that pigment in plant leaves,
chlorophyll, strongly absorbs visible light (from 0.4 to 0.7 microns)
for use in photosynthesis. The cell structure of the leaves, on the
other hand, strongly reflects near-infrared light (from 0.7 to 1.1
microns). Absorbtion at this wavelength is not useful to synthesize
organic molecules and would only result in overheating the plant and
possibly damaging the tissues. The NDVI index is the normalized ratio
of the difference in reflected energy between the two bands:
(near-infrared minus visible)/(near-infrared+visible). The larger the
index, the more active vegetation cover, indicated by green in the
images.
The images were downloaded from the MODIS "Rapid Response" link for the Alaska North Slope region.
Flash based applications used for interactive animations were
developed
by Tom Whittaker of the Space Science and Engineering Center SSEC,
University of Wisconsin-Madison. This requires Flash to be installed on your computer for the animations to work.
Table 1. Latest images
for selected areas
Table
2. Movies (10 day intervals): 2012 Spring-Summer
with overlays from 2011
Table
3. Movies (10 day intervals): 2011 Summer-Fall
Table 3. RGB Movies for 2012-2013
Disclaimer. The products from GOES or other
satellites
shown here are experimental. These have been generated within a
research environment and are not intended to be considered operational.
Timeliness, availability, and accuracy are sought but not guaranteed.
Return to CIMSS
(UW-Madison)
or NSSL (NOAA/NSSL).
Last update was 25 June 2012. Feedback.