
Research Tools: Oklahoma Lightning Mapping Array
The National Severe Storms Laboratory and the University of Oklahoma jointly operate the Oklahoma Lightning Mapping Array (OKLMA) to map the time and location of lightning channel segments within clouds in three dimensions with high resolution. To do this, the system measures the time at which a signal radiated by a lightning channel in a VHF band (the former television channel 3 band) arrives at each station in the OKLMA network. The times are transmitted to a central station, which computes the time, latitude, longitude, and height of the segment that radiated the signal.
Since 2003, there have been 10-11 stations in central Oklahoma. In April 2012, seven additional stations were added in southwest Oklahoma. Thousands of VHF points can be mapped for an individual lightning flash within 200 km of the stations, to reveal its location and the development of the lightning structure.
NSSL is also building a purely mobile set of stations to acquire lightning observations in field campaigns outside of Oklahoma. These high-resolution datasets are used to evaluate operational lightning observations which cover a larger area but which may have lower resolution or observe different physical processes that occur during a lightning flash.
View the real time OKLMA data stream: https://apps.nssl.noaa.gov/oklma/.
NSSL scientists hope to use the data from OKLMA to learn more about how storms produce intra-cloud and cloud-to-ground flashes and changes in lightning flashes are related to tornadoes and other severe weather. Better lightning mapping techniques show that some supercell thunderstorms have “lightning holes” where updrafts are located and precipitation is scarce. If these holes form, as suspected, just before a storm becomes severe, this information could alert forecasters to developing severe conditions. Some storms also produce additional VHF at the top of their updrafts, which might be used to monitor rapid changes in the updraft due to the continuous, three-dimensional nature of the OKLMA measurements. NSSL scientists are also researching what the altitudes of these flashes might tell us about how ice and hail particles are changing within the storm.
The OKLMA was an integral part of the 2003 and 2004 Thunderstorm Electrification and Lightning Experiment (TELEX) and the Deep Convective Clouds and Chemistry (DC3) field project.
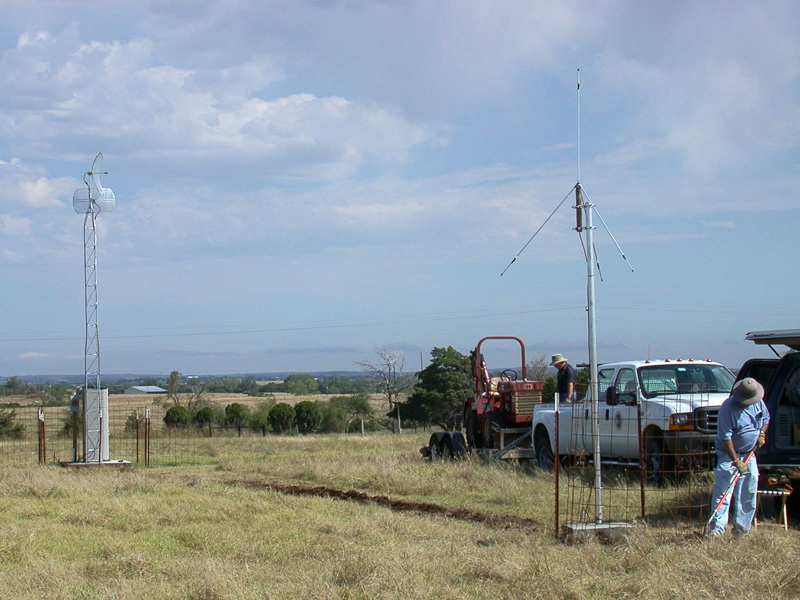
OKLMA site north of Chickasha, OK. The VHF antenna on the right receives signals in the channel 3 television band. This signal is processed by electronics in the small plastic building on the left of the picture to determine the time at which the signal is received to within less than a millionth of a second. This time and information about the signal is then sent back to a central processor in Norman via the communication antenna beside the plastic building. The central processor records the information from all stations and, in real time, uses the times from several antennas to determine the three-dimensional location at which a lightning channel segment radiated the signal.
These data are being used with radar and other storm measurements in scientific studies to help understand how thunderstorms produce lightning and to develop ways of using lightning mapping data to warn and forecast of weather hazards.
[+]OKLMA site north of Chickasha, OK. The VHF antenna on the right receives signals in the channel 3 television band. This signal is processed by electronics in the small plastic building on the left of the picture to determine the time at which the signal is received to within less than a millionth of a second. This time and information about the signal is then sent back to a central processor in Norman via the communication antenna beside the plastic building. The central processor records the information from all stations and, in real time, uses the times from several antennas to determine the three-dimensional location at which a lightning channel segment radiated the signal.
These data are being used with radar and other storm measurements in scientific studies to help understand how thunderstorms produce lightning and to develop ways of using lightning mapping data to warn and forecast of weather hazards.
An intracloud (IC) flash observed by the OKLMA between an upper negative and a lower positive charge layer in a severe storm on May 29, 2012. Each panel shows different dimensions (from x, y, z, t) of the same flash.
Top: shows time and altitude. Middle: east distance and altitude. Lower Left: east and north distance. Lower Right: north distance and altitude.
[+]An intracloud (IC) flash observed by the OKLMA between an upper negative and a lower positive charge layer in a severe storm on May 29, 2012. Each panel shows different dimensions (from x, y, z, t) of the same flash.
Top: shows time and altitude. Middle: east distance and altitude. Lower Left: east and north distance. Lower Right: north distance and altitude.